Live · Recurring · Hands-on

Stategraph Demo Day

Every few weeks we go live with what we're building. No slideware — real terminals, real state, and an open Q&A where you can ask anything about running Terraform at scale.

  • A technical deep dive into how Stategraph actually works state as a queryable graph, not a flat file
  • First looks at new features before they ship cost, inventory, parallel plan & apply, and more
  • Live Q&A with the people writing the code scale, self-hosting, migration — nothing off-limits

Watch past demo days

Every session, recorded. Newest first.

Stategraph Demo Day — Stategraph Cost
Demo Day June 24, 2026

Stategraph Cost

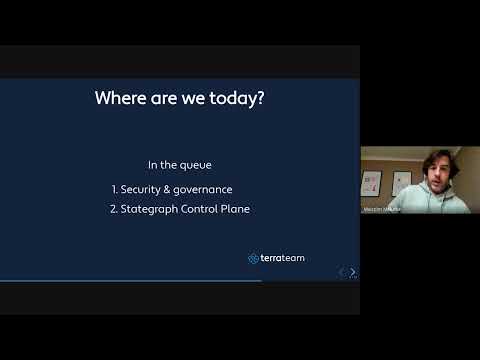
A technical deep dive into Stategraph, plus the first live look at Stategraph Cost: estimation and actuals surfaced right inside your terraform plan — what a change costs before you apply it, attributed by team, owner, or environment.
Stategraph Demo Day — Stategraph Velocity
Demo Day February 26, 2026

Stategraph Velocity

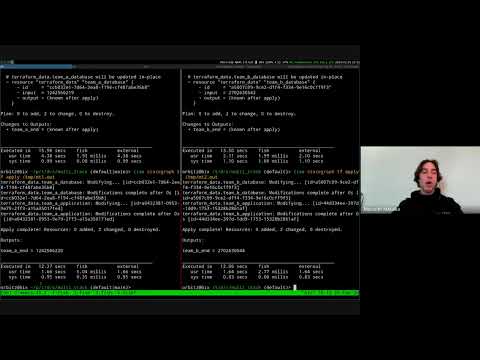
Velocity went live: fast plan and apply, parallel execution, and multi-state transactions — plan and apply running hundreds of times faster, with a live demo of why it changes how you operate on Terraform.

Stategraph Demo Day — Insights and Inventory
Demo Day January 19, 2026

Insights and Inventory

The State Backend, Insights, and Inventory shipped with unlimited pricing, and Gap Analysis that generates Terraform code for unmanaged resources. The first session where we stopped showing and started shipping.

Stategraph Demo Day — Inventory and faster plans
Demo Day December 17, 2025

Inventory and the path to faster plans

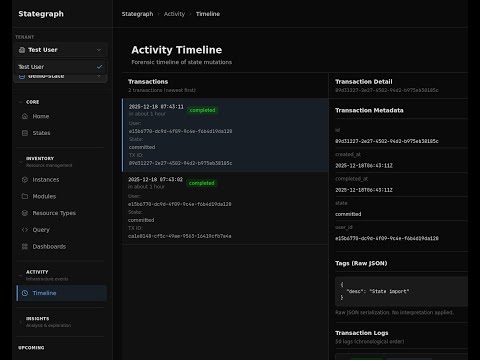
Inventory management with a transactional interface, queryable UI, and a metadata-rich timeline — plus the technical foundation for parallel operations: extracting dependency cones from HCL so unchanged resources sit out the plan.

Stategraph Demo Day — Importing state into a queryable graph
Demo Day November 19, 2025

Importing state into a queryable graph

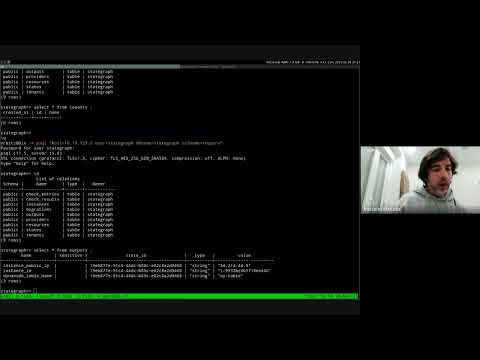
The first look at Stategraph: importing state files into a structured database, querying resources and dependencies, and visualizing the infrastructure graph — 20k resources in 3 seconds. The Q&A dug into scale, self-hosting, and module boundaries.